利用梯度下降构造一个简单实用的分类器。
# 序
通过不同函数实现计算损失、计算梯度及梯度下降的功能,每一步会更明确、简洁,同时逻辑也更加清晰。本贴基于上述方式记录利用梯度下降实现 logistic regression 的过程。
# import modules
import numpy
import pandas
# sigmoid function
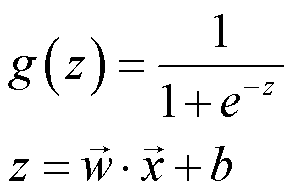
后续计算损失、梯度时会经常使用该激活函数,因此不妨构造该函数以便后续调用。激活函数的公式如下:


代码实现如下所示。需要注意的是,参数 z 需要传入 wx+b 。
def sigmoid(z):
    return 1 / (1 + numpy.exp(-z))
# compute cost
构造一个能便捷地得到每次迭代损失的函数,有助于记录每次迭代的损失,便于调试与出图。损失由一下公式计算:

代码实现如下:
def compute_cost(X, y, w_in, b_in):
    """
    compute the cost over all examples
    :param X: (ndarray Shape(m, n)) dataset, m samples by n features
    :param y: (array_like Shape(m,)) target values for all samples
    :param w_in: (array_like Shape(n,)) values of parameters of the model
    :param b_in: scalar Values of bias parameter of the model
    :return: the loss
    """
    m, n = X.shape
    cost = 0
    for i in range(m):
        cost += (y[i] * numpy.log(sigmoid(numpy.dot(w_in, X[i]) + b_in)) + (1 - y[i]) * numpy.log(1 - sigmoid(numpy.dot(w_in, X[i]) + b_in)))
    return (-1 / m) * cost
# compute gradient
在梯度下降过程中经历数次迭代,其中每次迭代需重新计算梯度。不妨构造一枚计算梯度的函数以便调用并简化梯度下降的代码。
其中,计算梯度的数学公式如下:

代码实现如下:
def compute_gradient(X, y, w_in, b_in):
    """
    compute gradient for each iteration
    :param X: (ndarray Shape(m, n)) dataset, m samples by n features
    :param y: (array_like Shape(m,)) target values for all samples
    :param w_in: (array_like Shape(n,)) values of parameters of the model
    :param b_in: scalar Values of bias parameter of the model
    :return: the gradient dj_dw and dj_db
    """
    m, n = X.shape
    dj_dw = numpy.zeros(n)
    dj_db = 0
    for j in range(n):
        for i in range(m):
            dj_dw[j] += (sigmoid(numpy.dot(w_in, X[i]) + b_in) - y[i]) * X[i][j]
    dj_dw /= m
    for i in range(m):
        dj_db += (sigmoid(numpy.dot(w_in, X[i]) + b_in) - y[i])
    dj_db /= m
    return dj_dw, dj_db
# gradient descent
传入训练数据、模型初始参数、学习率及迭代次数并调用损失计算函数及激活函数进行梯度下降。其中,梯度下降同步更新数学公式如下:

代码实现如下:
def gradient_descent(X, y, w_in, b_in, alpha, iters):
    """
    run gradient descent
    :param X: (ndarray Shape(m, n)) dataset, m samples by n features
    :param y: (array_like Shape(m,)) target values for all samples
    :param w_in: (array_like Shape(n,)) values of parameters of the model
    :param b_in: scalar Values of bias parameter of the model
    :param alpha: learning rate α
    :param iters: iterations for gradient descent
    :return:
    """
    m_in, n_in = X.shape
    for inum in range(iters):
        dj_dw, dj_db = compute_gradient(X, y, w_in, b_in)
        for j in range(n_in):
            w_in[j] = w_in[j] - alpha * dj_dw[j]
        b_in = b_in - alpha * dj_db
    loss_in = compute_cost(X, y, w_in, b_in)
    return w_in, b_in, loss_in
# predict
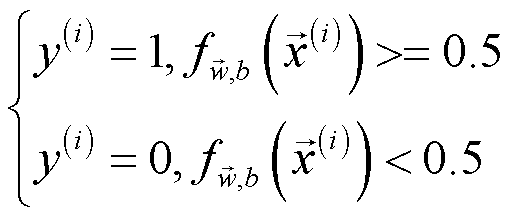
分类准确率是一个能直观评价模型优劣的指标之一。将学习得到的参数赋予 logistic regression 并计算出预测值,然后与原始的输出变量比较得到准确率。对该分类算法来说,当激活函数输出值大于等于0.5时预测该样本属于正例,否则属于负例。该函数仅对目标变量进行预测,并不是最终的准确率。想要得到准确率,还需将预测结果与真实结果对比。

预测目标变量的函数的代码实现如下:
def predict(X_pred, w_pred, b_pred):
    """
    make predictions with learned w and b
    :param X_pred: data set with m samples and n features
    :param w_pred: values of parameters of the model
    :param b_pred: scalar value of bias parameter of the model
    :return:
    """
    predictions = sigmoid(numpy.dot(X_pred, w_pred) + b_pred)
    p = [1 if item >= 0.5 else 0 for item in predictions]
    return numpy.array(p)
需要注意的是,返回的为 ndarray 。若与 ndarray 进行值的比较,可能需要额外的维度变换(reshape)。
之前输出的 list 与 ndarray 对比总是出问题。
# main
在此导入数据,并定义数据集和标记的列表,然后结合上述函数实现一个基于梯度下降的 logistic regression 。
# 导入数据到一个DataFrame
data = pandas.read_csv('data/data.txt', header=None, names=['x1', 'x2', 'target'])
# 获取列数(包括输出变量)
colNum = data.shape[1]
# 定义数据集(不含输出变量)
X_train = data.iloc[:, :colNum - 1]
X_train = numpy.array(X_train.values)
# 定义输出空间
y_train = data.iloc[:, colNum - 1: colNum]
y_train = numpy.array(y_train.values)
# 获取样本量和特征数
m, n = X_train.shape
numpy.random.seed(1)
w_init = numpy.zeros(n)
b_init = 0
w, b, loss = gradient_descent(X_train, y_train, w_init, b_init, alpha=0.001, iters=10000)
print(f'w = {w}\nb = {b}\nloss = {loss}')
# 准确率
pred = predict(X_train, w, b)
print('Train Accuracy: %f'%(numpy.mean(pred == y_train.reshape(-1)) * 100))
# 补充
绘图和特征工程将在 regularized_logistic_regression 一贴中展示,因为该实例仅有两个不含高次项的特征,决策边界仅为一条直线。
完整代码